COVID and Adaptive Management

David Marmorek
Lead Scientist | Senior Partner, ESSA Bio | in
What is Adaptive Management?
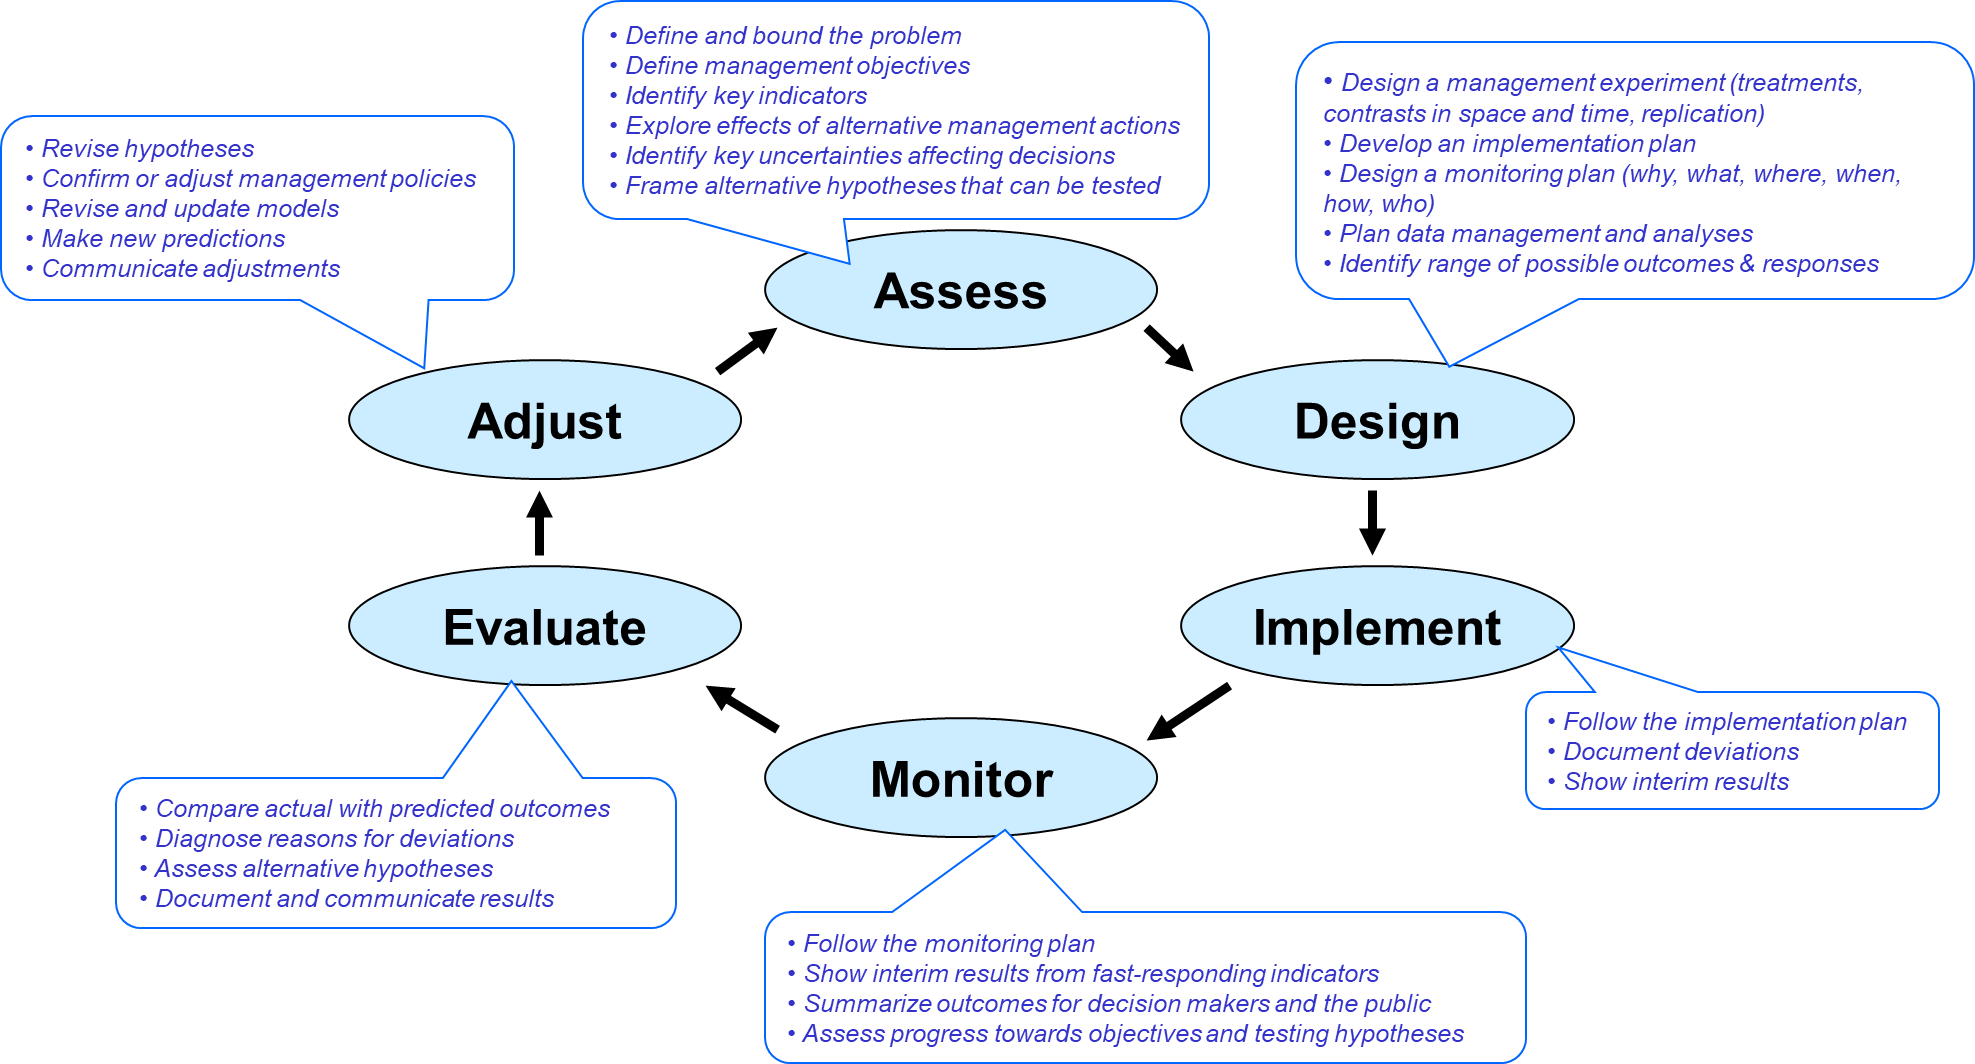
As described elsewhere on this website, Adaptive Management (AM) is systematic, practical approach for improving management policies and practices. It provides a structured process for learning which management actions best meet management objectives, and for reducing management uncertainty. In its most effective form, an experimental approach is used to test clearly formulated hypotheses about important, but uncertain, components of a system. Typically, AM is applied through a 6-step process:
What does AM have to do with COVID-19?
Jurisdictions around the world are now considering when and how to re-open their societies and economies in a manner that meets economic, social and health objectives. Some jurisdictions have flattened the curve dramatically and implemented extensive testing and contact tracing; others have not done any of these things but are still re-opening their economies (See Lessons Learned from COVID-19 about Resilience). Let’s take a tour through the first two steps of the AM cycle with a COVID perspective, asking the questions we would typically ask when grappling with an ecological problem. We focus just on the first two steps since they set the foundation for the rest of the AM cycle.
Assess. Formally defining objectives and associated indicators may seem at first trivial (e.g., let’s just restore things to what they were), but closer inspection may spark more creative thinking (e.g., let’s rebuild our economic and health systems back in a different way, one that is stronger and more resilient to pandemics, addressing the societal weaknesses revealed by COVID-19). In some forums, there have been simplistic arguments of the trade-offs between health and economic objectives (e.g., “We can’t afford to shut down the economy with health isolation measures”), when what is required is a much more detailed and nuanced risk assessment of which sectors can be safely opened when, where and how. Lessons from the 1918 influenza pandemic are instructive – municipalities which put in place Non-Pharmaceutical Interventions (NPIs) more quickly and more intensively had both fewer deaths (Hatchett et al. 2007), as well as faster and stronger economic recovery once the pandemic had subsided (Correia et al. 2020). These analyses would suggest that achievement of health objectives is a pre-requisite to the achievement of economic objectives.
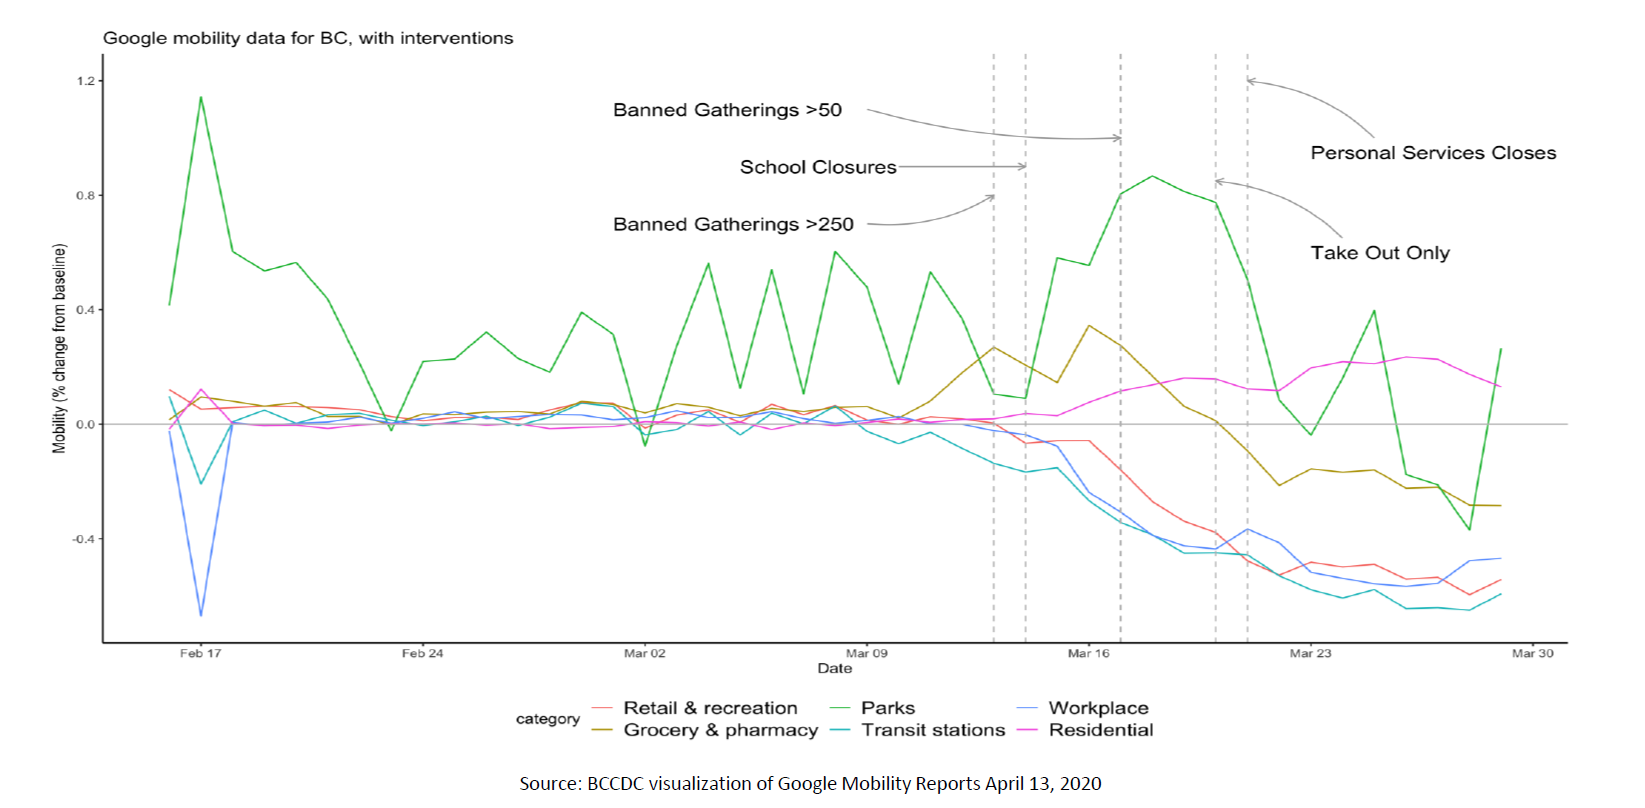
Measuring progress towards objectives requires a suite of indicators that provide an early warning of potential problems. Creative thinking is required to generate indicators that penetrate to the heart of a problem and provide insights on alternative hypotheses. For the health objectives, indicators might be stratified by vulnerable sub-populations which require more intensive monitoring (e.g., people with compromised immune systems, seniors, seniors in long-term care, workers in meat packing plants and other densely populated indoor factories, people in prisons) and might involve a suite of progressive indicators along the time course of infection and pathway to either recovery or death (e.g., living or working in a high risk area, potential contacts with a COVID-positive person, self-monitored changes in symptoms, symptoms requiring medical attention, results of a medical examination, viral tests of current infection, viral intensity, antibody tests of previous infections, exposure admission to hospital, admission to critical care). At a higher scale, the basic reproduction number (R0; the average number of new infections per infected person) provides an integrated picture of transmission rates over time and space. Google mobility reports provide rapid feedback on changes in the distribution of people (figure below). For the economic objectives, the standard suite of indicators may need to be supplemented to reflect adaptation of the work force, such as the proportion of businesses that have diversified services to maintain revenues, or the number of individuals that have shifted their form of employment due to long term cessation of their previous line of work (e.g., people employed in the performing arts or professional sports).
There are a huge number of biological uncertainties about the coronavirus, just as every environmental problem has a huge number of ecological uncertainties. However, the set of critical uncertainties which affect management decisions is always much smaller. One generic way to phrase such uncertainties is: “Is it safe for socioeconomic activity X to operate under appropriate guidelines, or will X spark a new cluster of cases, requiring closure?”. Structured decision making or formal decision analysis can help to elucidate which uncertainties change the relative performance of alternative actions against listed objectives, versus merely scaling the performance of all alternatives up or down. Often it turns out that only a small fraction of uncertainties change which decision is optimal. Here’s an example from the salmon world: Peters et al. (2000) found that out of 15 uncertainties affecting endangered Chinook salmon in the Snake River, only 3 affected the relative performance of actions at dams along the Snake and Columbia Rivers. Which of the many uncertainties affecting COVID-19 and its impacts would change management decisions for public health and the economy?
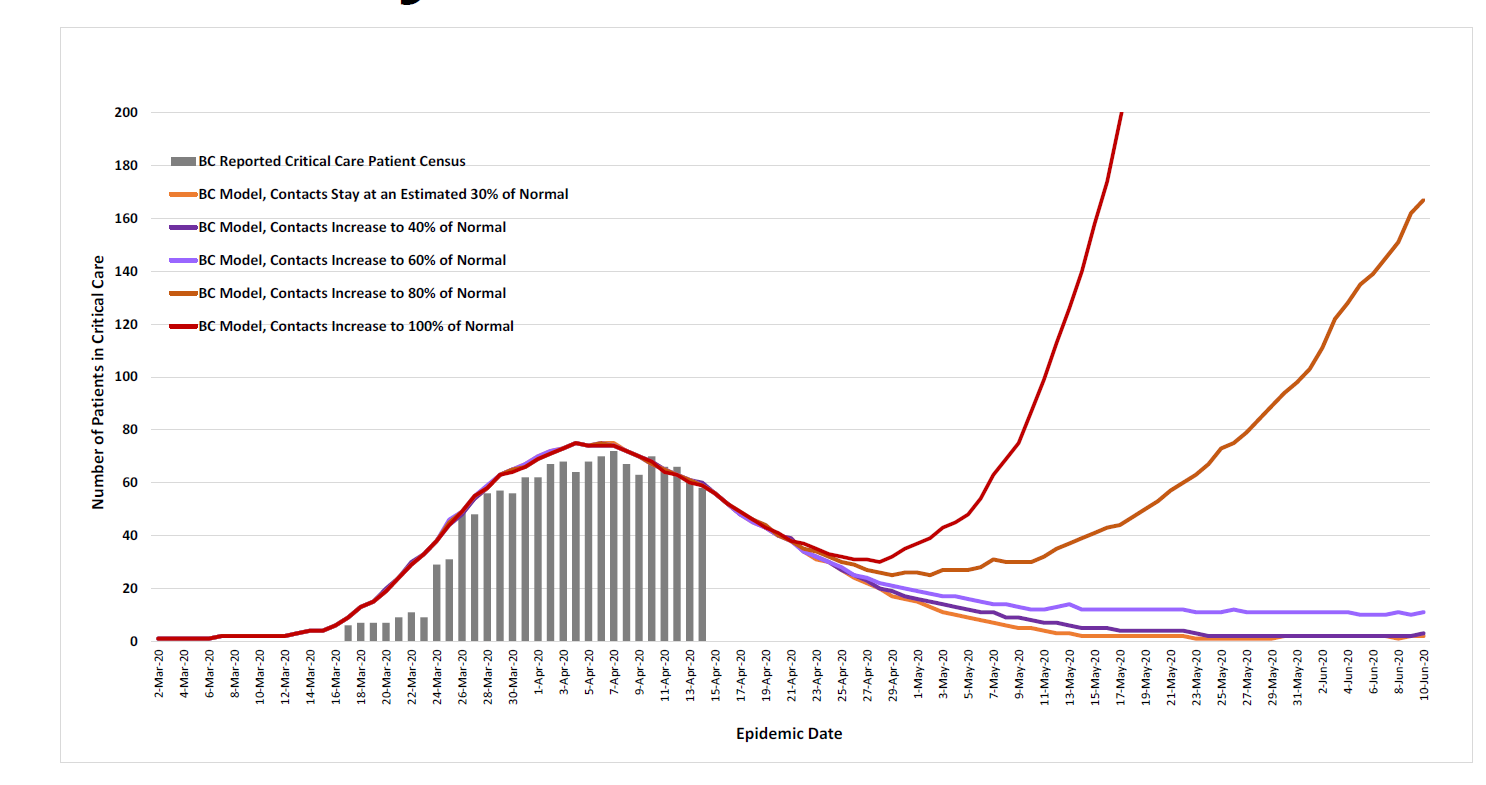
Modelling COVID-19 is challenging (Koerth et al., 2020). As for ecological models, modelling COVID-19 requires a careful blend of mechanistic and empirical approaches, with frequent updating of model parameters based on observations (e.g., BC Ministry of Health 2020). Despite these challenges, models which mechanistically simulate disease spread and the time lags in infection and recovery (e.g., BC Ministry of Health 2020) can provide a range of testable hypotheses about the effects of lessening NPIs and project the effects of different actions (see figure below). In a detailed analysis of the EIS predictions for the impacts of hydro-electric projects in Canada, we found that an explicit quantitative prediction which is later proven wrong is still more helpful than a nebulous prediction which can’t be tested (Bernard et al. 1989). Some models are however clearly inadequate: statistical models which fit a curve to cases in other countries like China and Italy and assume that pattern will apply elsewhere have proven to be very inaccurate (Piper 2020). Based on modelling and the advice of experts, which socioeconomic activities have the greatest risk? Given the current pattern of confirmed cases, which parts of the country, province or state are the safest places to conduct re-opening experiments, with adequate testing, contact tracing and isolation given the number of cases (see Pueyo 2020)? Embedding models in a decision analysis framework, as discussed above, can focus attention on the model uncertainties most critical to decisions.

Dynamic modelling of critical care implications of varying levels of increase in contact. Source: Source: BC Ministry of Health 2020 (slide 34)
Design. AM is not just a process of “trial-and-error”, or “adapt-as-you go”. That’s what we call “Pretend AM”. Without a strong experimental design that clearly separates the signal from the noise, you have little hope of detecting or evaluating the effects of your actions. Contrasts in space and time, combined with precise monitoring indicators, sharpen the signal of your experimental action and dampen the noise. Spatial variation in conditions across sub-regions within a jurisdiction provides opportunities for creating strata that may have different treatments (e.g., safer to re-open certain businesses in areas with zero or very few active cases). Replication increases statistical power to detect effects. For ecological problems, like flow releases from a dam to benefit fish, it is valuable to simulate the ability of different experiments to test the hypotheses of interest, and examine trade-offs between different management objectives (e.g., Alexander et al. 2006). Such analyses need to reflect various forms of uncertainty: parameter uncertainty in the models; the uncertainty in whether actions will be implemented as designed in step 3 of the AM cycle (e.g., the degree to which citizens will follow recommended NPIs); measurement errors in monitored indicators during step 4 of the AM cycle (e.g., false positive rates can be very high during the early stages of infection – Kucirka et al. 2020); and the analytical uncertainty in evaluations of monitored data (in step 5 of the AM cycle) to draw conclusions about whether or not management actions should be adjusted.
If a jurisdiction has flattened the curve of new cases, and has sufficient testing, contact testing, and isolation procedures, then incremental and well-designed re-opening experiments can proceed, stratified across different sectors and regions, with rapid data analysis and feedback to decision makers. High schools in Germany have re-opened, testing students for COVID-19 every four days, with test results emailed to the student that evening; those students who test negative wear a green sticker and are allowed to move around the school without a mask (Bennhold 2020). Creative experimental designs are an essential part of AM. Karin et al. (2020) used mathematical modelling to show that a cyclic schedule of 4-day work and 10-day lockdown, or similar variants, can prevent resurgence of the epidemic while providing part-time employment. The cycle reduces the basic reproduction number R0 below one by reduced exposure time, and by exploiting the virus latent period. People who get infected during workdays reach peak infectiousness during lockdown days; they then remain isolated until their symptoms are resolved. The number of workdays can be gradually adapted over time in response to observations. Throughout, full epidemiological measures need to continue including hygiene, physical distancing, compartmentalization, testing and contact tracing.
If however a jurisdiction has not yet flattened the curve of new cases, and/or does not have adequate testing, contact tracing and isolation procedures, then the noise of the first wave of COVID-19 cases, and amplifications through community transmission, will drown out the signal created by re-opening various sectors of the economy. It will not be possible to separate the effects of the first wave of infections from subsequent waves. The two waves will reinforce each other in a deadly form of Pretend AM.
It’s easier to do an experiment in a closed system. Countries which have flattened the COVID curve (e.g., New Zealand, Taiwan, South Korea) can move forward with re-opening experiments and through border control ensure that these experiments won’t be confounded or undermined by the uncontrolled arrival of infected people from outside their country. This is much more difficult to do (though not impossible) for a state or province which has far less control over the movement of people from adjacent regions.
Finally, AM is a collaborative exercise involving stakeholders. In Canada, work on the pandemic by federal and provincial governments has been done by experts, closely coordinating with other levels of government, with frequent communications to the public and consultations with some non-government organizations. However, there hasn’t been time for consultations at the community level. Over the long term, investment in community consultations will be essential to ensure that citizens buy in to the strategies required to successfully meet health, social and economic objectives. For climate change mitigation and adaptation, we’ve recently described the benefits of melding the principles and procedures of AM with those used in the practice of Climate Change Adaptation (CCA; Marmorek et al. 2019). A similar melding of expertise in epidemiology, economics and methods of community involvement will likely increase the probability of successfully meeting multiple objectives, and rebuilding the resilience of our society and economy.
References
Alexander, C.A.D., C.N. Peters, D.R. Marmorek and P. Higgins. 2006. A decision analysis of flow management experiments for Columbia River mountain whitefish management. Can. J. Fish. Aquat. Sci. 63: 1142-1156.
BC Ministry of Health. 2020. COVID-19: Where we are. Considerations for next steps. https://news.gov.bc.ca/files/COVID19_Update_Modelling-DIGITAL.pdf
Bennhold, K. 2020. As Europe re-opens schools, relief combines with risk. New York Times. May 10, 2020. https://www.nytimes.com/2020/05/10/world/europe/reopen-schools-germany.html
Bernard, D.P., D.B. Hunsaker Jr., and D.R. Marmorek. 1989. Tools for improving predictive capabilities of environmental impact assessments: structured hypotheses, audits, and monitoring. In: The Scientific Challenges of NEPA: future directions based on 20 years of experience. (Eds: S. Hildebrand and J.B. Cannon). Based on the Ninth Oak Ridge National Laboratory, Life Sciences Symposium, Knoxville, TN, October 24-27, 1989. Lewis Publishers. Ann Arbor. pp. 547-564.
Correia, S., Luck, S. and Verner, E. 2020. Pandemics Depress the Economy, Public Health Interventions Do Not: Evidence from the 1918 Flu (June 5, 2020). Available at SSRN: https://ssrn.com/abstract=3561560 or http://dx.doi.org/10.2139/ssrn.3561560
Hatchett, R.J., C.E. Mecher and M. Lipsitch. 2007. Public health interventions and epidemic intensity during the 1918 influenza pandemic. PNAS 104(18): 7582-7587. www.pnas.org_cgi_doi_10.1073_pnas.0610941104
Koerth, M., L. Bronner and J.Mithani. 2020. Why it’s so freaking hard to make a good COVID-19 model. FiveThirtyEight. March 31, 2020. https://fivethirtyeight.com/features/why-its-so-freaking-hard-to-make-a-good-covid-19-model/
Kucirka LM, Lauer SA, Laeyendecker O, Boon D, Lessler J. 2020. Variation in False-Negative Rate of Reverse Transcriptase Polymerase Chain Reaction–Based SARS-CoV-2 Tests by Time Since Exposure. Ann Intern Med 2020; May 13, 2020: [Epub ahead of print]. https://www.acpjournals.org/doi/10.7326/M20-1495
Marmorek, D., M. Nelitz, J. Eyzaguirre, C. Murray, and C. Alexander. 2019. Adaptive Management and Climate Change Adaptation: Two Mutually Beneficial Areas of Practice. Journal of the American Water Resources Association 55 (4): 881–905. https://doi.org/10.1111/1752-1688.12774
Peters, C.N. and Marmorek, D.R. 2001. Application of decision analysis to evaluate recovery actions for threatened Snake River spring and summer chinook salmon (Oncorhynchus tshawytscha). Can. J. Fish. Aquat. Sci. 58(12):2431-2446.
Pueyo, T. 2020. Coronavirus : how to do testing and contact tracing. Medium – April 28, 2020. https://medium.com/@tomaspueyo/coronavirus-how-to-do-testing-and-contact-tracing-bde85b64072e
Piper, K. 2020. This coronavirus model keeps being wrong. Why are we still listening to it? Vox. May 5, 2020. https://www.msn.com/en-ca/news/world/this-coronavirus-model-keeps-being-wrong-why-are-we-still-listening-to-it/ar-BB13w7BK?li=AAggNb9

